Why Control Plants Are the Most Underrated Tool in Cannabis Cultivation
Every grower has a theory. Maybe you're convinced that adding silica boosted your last harvest, or that switching to a 20/4 light schedule gave you bushier plants. But without control plants — plants grown under identical baseline conditions with no experimental variables — you're guessing. The yield difference you noticed could just as easily be explained by a different phenotype, a slight temperature swing, or the fact that you watered a day later. Control plants remove that ambiguity entirely.
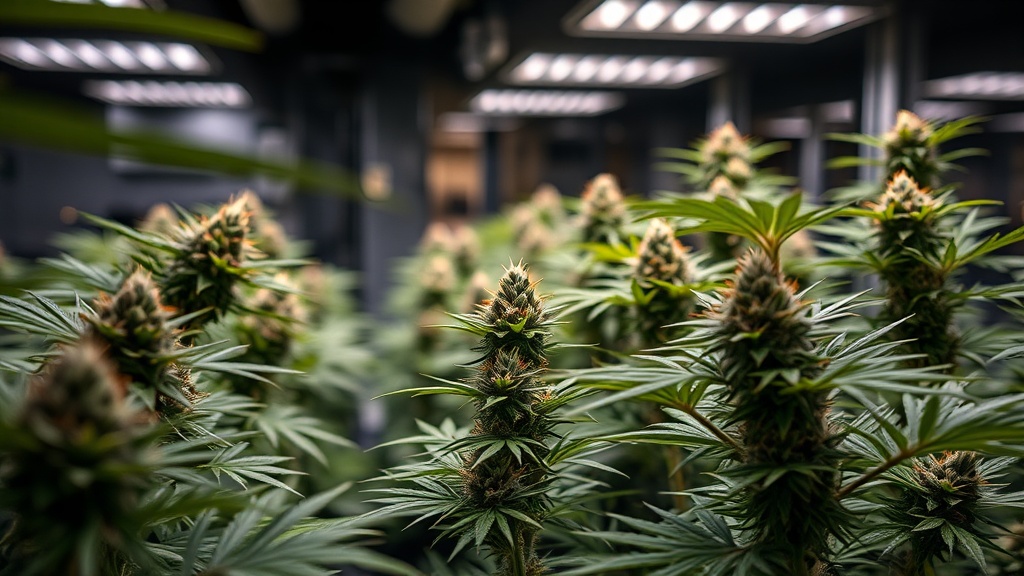
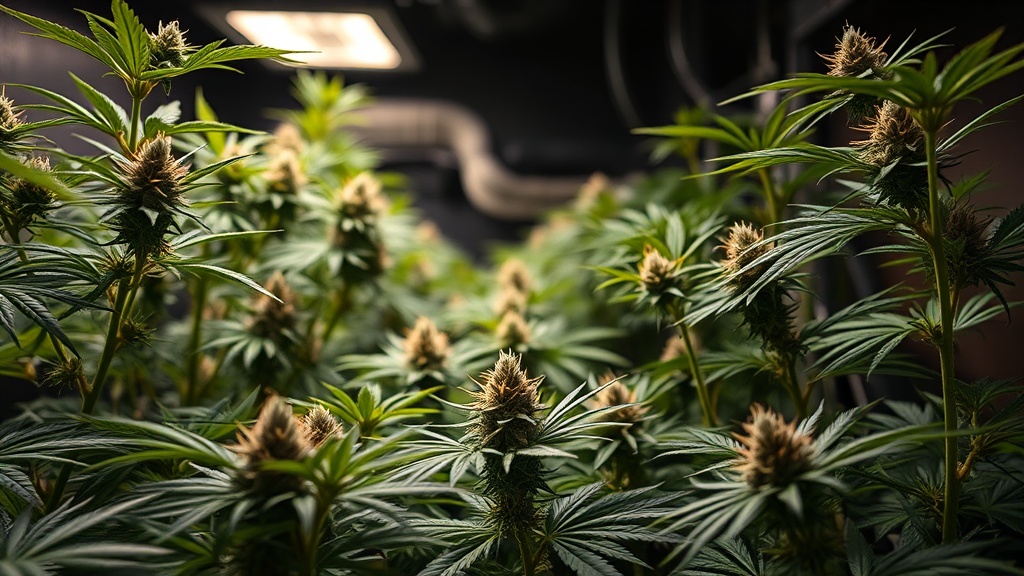
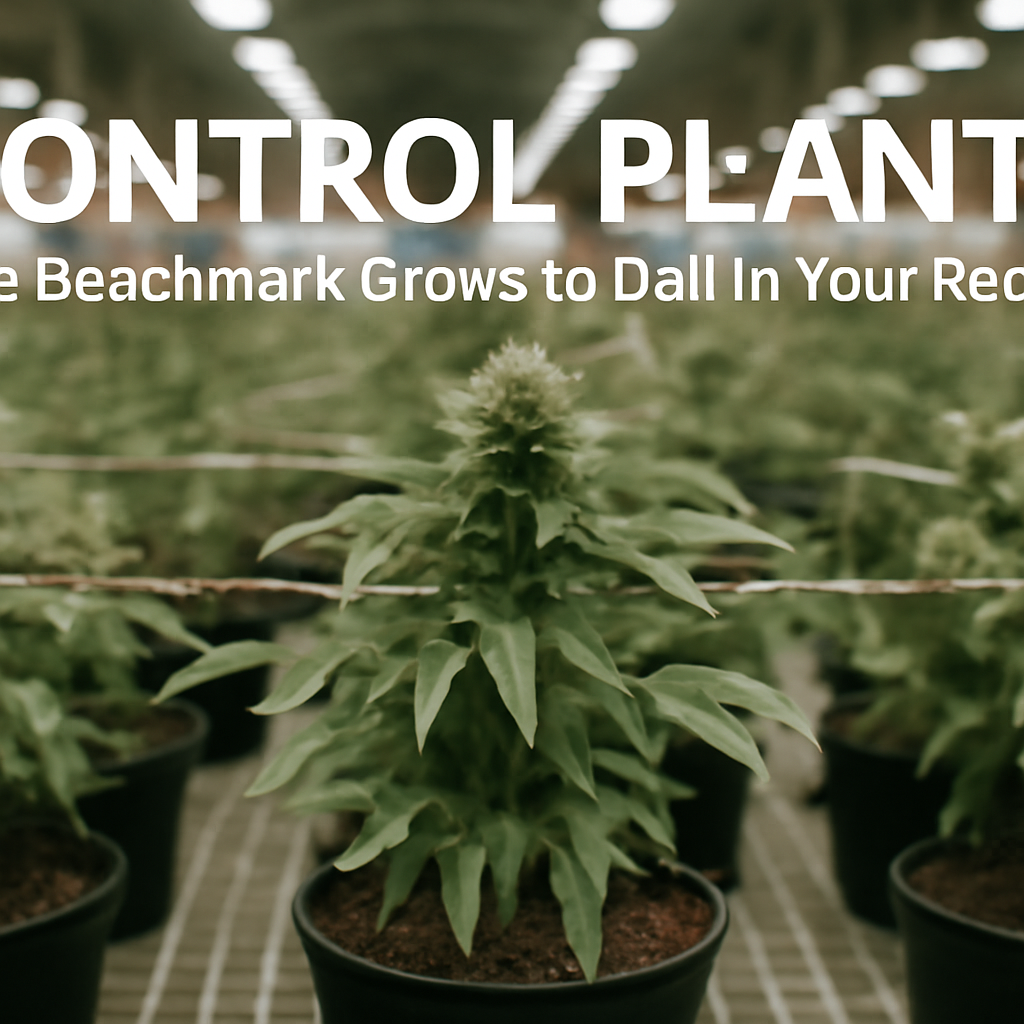
According to data from Grow Guide's platform, 73.6% of tracked grows happen indoors — the environment where variables are easiest to isolate and where control plants deliver the clearest results. Whether you're testing a new training technique, trialling a different nutrient line, or dialling in your VPD, running a proper control plant protocol turns your grow room into a real experiment with real answers.
What Exactly Is a Control Plant?
A control plant is a cannabis plant grown under your standard, unmodified conditions. It receives your baseline nutrient schedule, your standard light intensity, your usual training approach (or none), and your default environmental settings. Every other plant in your experiment — the "experimental" plants — gets exactly the same treatment except for one variable you're testing.
The golden rule: change only one thing at a time. If you alter both your nutrient EC and your light schedule simultaneously, you have no way of knowing which change caused the yield difference. Control plants enforce discipline on your methodology. Use your Grow Schedule Planner to map out each plant's treatment from seed so nothing slips.
What Makes a Valid Control Plant
- Same genetics: Use clones from the same mother, or seeds from the same pack (ideally feminised). Phenotype variation between plants from different seeds will pollute your results.
- Same container size: A 5-gallon pot vs. a 3-gallon pot changes root zone volume and watering frequency significantly.
- Same substrate: Grow Guide data shows 63.2% of growers use soil — whatever medium you run, both control and experimental plants need to use the same batch of the same brand.
- Same light position: PPFD drops sharply with distance. Millimetres matter under intense LEDs. If your control is 18 inches from the canopy and your test plant is 20 inches away, you've introduced a second variable.
- Same watering triggers: Water when the top inch of substrate is dry, or use consistent weight-based watering. Don't eyeball one and weight-check the other.
Setting Up Your Control Plant: A Step-by-Step Protocol
Step 1 — Define the Baseline
Before your grow starts, write down every standard parameter you use. This becomes your control protocol. At minimum, document:
- Nutrient EC range: vegetative 1.2–1.8, flowering 1.8–2.4
- pH range: 6.0–6.5 (soil), 5.5–6.2 (coco/hydro)
- PPFD targets: ~400–600 µmol/m²/s (veg), 600–900 µmol/m²/s (flower)
- VPD: 0.8–1.0 kPa (veg), 1.0–1.5 kPa (flower)
- Temperature: 22–26°C lights on, 18–22°C lights off
- Light schedule: 18/6 (veg), 12/12 (flower)
Your control plant never deviates from these numbers. Use the Grow Light Calculator to confirm your PPFD is where you think it is at your canopy height.
Step 2 — Define the Single Variable You're Testing
Common experiments growers run with control plants include:
- Training methods: Control = no training. Experimental = topped at node 3. See our Fimming vs Topping guide for training protocols to test.
- Nutrient lines: Control = your existing base nutrients. Experimental = a new organic line at the same EC. See Best Organic Nutes for Cannabis for candidates.
- Light intensity: Control = 600 µmol/m²/s. Experimental = 800 µmol/m²/s (same spectrum).
- Substrate: Control = soil. Experimental = coco at the same pot size and EC.
- CO₂ supplementation: Control = ambient ~400 ppm. Experimental = enriched to 1000–1200 ppm.
Step 3 — Track the Same Metrics Across All Plants
Your control plant is only useful if you're measuring the same data points from both plants at the same intervals. Log weekly in your grow diary:
- Height (cm) from substrate surface to top cola
- Node count and internode spacing (cm)
- Leaf colour score (BBCH scale or simple 1–5 health rating)
- Any visible deficiency or stress symptoms — use the Nutrient Deficiency Identifier to code them consistently
- Runoff EC and pH (if using soil or coco)
- Dry weight at harvest (grams per plant)
Reading the Results: What Your Control Plants Are Telling You
At harvest, the comparison between your control plant and experimental plant gives you a direct, numbers-based answer. Use the Yield Calculator to project and then compare dry-weight outcomes. Here's how to interpret the three most common result patterns:
Experimental Plant Outperforms the Control
If your test plant yields significantly more dry weight — say 15% or more — and showed no additional stress markers, the variable you introduced is worth adopting as a new standard. Document the change in your protocol and make it the new control condition for your next experiment. "Significantly more" matters here: a 3–5g difference on a 60g plant could be phenotype variation, not your intervention.
Control Plant Outperforms the Experimental
This is still a win. You've just saved yourself from implementing something that actively hurts your yields. This happens frequently with high-EC experiments — growers push nutrients to EC 2.6+ expecting bigger buds, but the control at EC 2.0 consistently wins because the plant isn't fighting salt stress in late flower. Seeing that data on paper makes the decision easy.
Results Are Roughly Equal
Equal results mean the variable you tested doesn't justify the added cost or complexity. If your expensive silica supplement produced the same yield as the control with plain water, skip it and redirect that budget elsewhere.
Control Plants for Environmental Testing
Environmental variables are trickier to isolate because your entire grow room typically operates at one temperature and humidity level. The workaround is running sequential grows rather than simultaneous ones — use one grow as the control baseline, change one environmental parameter for the next grow with the same strain, and compare results using the same tracking sheet.
Key environmental parameters worth testing one at a time:
- VPD: Run your control at VPD 1.0–1.2 kPa during flower. Test higher (1.3–1.5 kPa) in a follow-up grow to see if transpiration-driven nutrient uptake improves density.
- Temperature differential: Control = 4°C day/night swing. Experimental = 10°C swing (cooler nights) in late flower to trigger anthocyanin expression and potentially terpene development.
- CO₂ enrichment: Control = ambient. Experimental = 1000–1200 ppm CO₂ with matched PPFD increase to 900–1000 µmol/m²/s. Without the light intensity increase, additional CO₂ produces minimal gains.
Harvesting and Post-Harvest: Keeping the Control Consistent
The harvest window is one of the most variable parts of a grow — and one where growers most often accidentally break their control protocol. Harvest both your control and experimental plants on the same trichome indicator, not the same calendar date. The standard target: 50–70% cloudy trichomes with 70% of pistils turned reddish-amber. Harvesting one plant two weeks before the other because it "looks ready" destroys the validity of your dry weight comparison.
Dry both plants in identical conditions: 60–70°F (15–21°C), 55–60% relative humidity, dark room, stems hanging whole for 7–10 days until small stems snap cleanly. Cure in the same batch of glass jars, burped daily for the first week, at the same storage temperature. The Dry & Cure Timer can help you track both plants on the same schedule. Inconsistent drying or curing will skew your final dry weight just as much as the variable you're testing.
Keeping a Grow Diary for Control Plant Experiments
A control plant experiment is only as good as your documentation. If you don't log data consistently, you'll be relying on memory by week 8 — and memory is notoriously unreliable. Use a structured grow diary with identical entry templates for each plant. See our guide on how to keep a cannabis grow diary for the core framework, then add a second column for your experimental plant's readings.
Photography is underrated data. Take photos of both plants on the same day each week, from the same angle, at the same distance. Side-by-side growth comparisons at week 4, 6, and 8 of flower often tell you more than a spreadsheet can. When you run your cost-per-gram analysis at the end, the Cost Per Gram Calculator can factor in whether your experiment actually improved the economics of the grow, not just the raw yield.
Common Mistakes When Running Control Plants
- Changing multiple variables: The single most common error. If you top your experimental plant and increase its nutrient EC, you have no idea which change caused the result.
- Placing plants in different light zones: Even a 15cm difference in horizontal position under an LED can mean a 50–100 µmol/m²/s PPFD difference. Use a PAR meter and position both plants at equal readings.
- Watering on different schedules: If your control plant dries out slightly faster because it's sitting 2cm closer to a fan, you've introduced another variable. Track water-in and drainage volume.
- Using different phenotypes: Seeds from the same pack can express very differently. If you only have bag seed, acknowledge phenotype variance as a limitation of your experiment — and ideally run 2–3 plants per treatment group to average it out.
- Harvesting at different trichome stages: Use the same trichome criterion for both plants, checked under the same magnification on the same day.
Frequently Asked Questions
How many control plants do I need per experiment?
Ideally, one control plant and one experimental plant is the minimum — but two of each per treatment group gives you much more reliable data by averaging out phenotype variation and random environmental differences. In a home grow with limited space, a 1:1 ratio is the practical standard.
Can I use an autoflowering strain for control plant experiments?
Autos work well for rapid testing (60–75 days seed to harvest) but have a significant drawback: you can't use clones, so every plant is a unique genotype. Phenotype variation between auto seeds can easily produce 20–30% yield differences with no experimental variable involved. Clones from a known mother plant give cleaner data for most experiments.
What's the minimum number of data points I need to trust my results?
A single grow cycle with one control and one experimental plant gives you directional data — enough to decide whether to run the test again. To be confident in a conclusion, replicate the same experiment across 2–3 consecutive grows. Consistent results in the same direction across multiple cycles are reliable; a single-cycle result could be noise.
Do I need to test nutrient pH the same way for both control and experimental plants?
Yes — measure pH at the same point in the watering process (e.g., always test the final mixed feed solution before application, and always test the first runoff), using the same calibrated meter. Calibrate your pH meter against fresh buffer solution every 2 weeks. Inconsistent measurement technique is a major source of hidden error in home grow experiments.
How do control plants help with troubleshooting deficiencies?
If your experimental plant shows a deficiency symptom but your control plant is healthy, the problem is almost certainly linked to your experimental variable — a high-EC nutrient solution locking out calcium, for example. If both plants show the same symptom, the cause is systemic to your grow room: pH drift, water quality, or environmental stress. Control plants let you triage faster and more accurately.
References
- Wikipedia Contributors (2026). "Cannabis Cultivation." Wikipedia. Covers standard environmental parameters including temperature range, humidity (40–60% RH), CO₂ requirements, and harvest trichome indicators. en.wikipedia.org/wiki/Cannabis_cultivation
- FloraFlex Media (2023). "Common Mistakes in Cannabis Cultivation and Their Solutions." FloraFlex Blog. Details overwatering consequences, optimal pH ranges (6.0–6.5 soil, 5.5–6.5 hydro), and nutrient burn causes from high EC feeds. floraflex.com
- MMJ (2023). "The Complete Guide to Drying and Curing Cannabis." MMJ.com. Specifies drying conditions (60–70°F, 55–60% RH, 7–10 days) and curing protocol (airtight glass jars, daily burping, 2–8 weeks minimum). mmj.com
- Chandra, S., Lata, H., & ElSohly, M.A. (2017). "Light Dependence of Photosynthesis and Water Vapor Exchange Characteristics in Different Chemotypes of Cannabis sativa L." Journal of Applied Research on Medicinal and Aromatic Plants. Establishes PPFD response curves relevant to light intensity experiments comparing control and experimental conditions.
- Grow Guide Platform Data (2026). Internal dataset of 1,000 tracked grow journals. Cited statistics: 73.6% of tracked grows are indoor, 63.2% use soil as primary substrate. growguide.app