What Is a Control Plant and Why Does It Matter?
A control plant is the cannabis cultivation equivalent of a scientific control group: one plant in your room or tent that you deliberately leave alone. No new training methods, no experimental nutrients, no tweaked lighting schedules. It grows under your proven baseline conditions while every other plant in the space gets subjected to whatever you're testing.
That single untouched plant becomes your most valuable data point. When something goes wrong — or spectacularly right — with your experimental plants, the control plant tells you whether it's your intervention that caused the change or just natural variation between individual plants. Without it, you're guessing. With it, you're learning.
According to Grow Guide platform data from over 1,000 tracked grows, 736 are run indoors — environments where variables like VPD, PPFD, and feeding schedules are highly controllable. That level of control makes indoor grows the perfect setting for running a proper control plant experiment. You can manipulate one variable at a time, read the results clearly, and apply what you learn to the next cycle with confidence.
Setting Up Your Control Plant Correctly
A control plant only delivers reliable data if it's genuinely comparable to your experimental plants. That means same strain, same germination date, same medium, same pot size, and same position in the grow space — or as close to equidistant from the light as you can manage. If your control plant sits directly under the light while your test plant sits at the edge, you're introducing a confounding variable before you've even started.
Matching the Baseline Conditions
- Temperature: 70–85°F (21–29°C) during lights-on, 65–75°F (18–24°C) during lights-off. Document these numbers — they're your baseline.
- VPD: 0.8–1.0 kPa in veg, 1.0–1.5 kPa in early flower. Use a VPD chart and keep your control plant in the sweet spot.
- PPFD: 400–600 µmol/m²/s in veg, 800–1000 µmol/m²/s in flower. Use a PAR meter to confirm both plants receive the same intensity. Our Grow Light Calculator can help you map coverage zones.
- Nutrients: Run a proven, dialled-in feed schedule. Soil growers should target pH 6.0–6.5; coco and hydro growers 5.5–6.0. EC should match your established baseline — typically 0.8–1.2 in early veg, ramping to 1.8–2.4 in peak flower for most strains.
- Watering: Water when the top inch of soil feels dry, or in coco, run daily with 10–20% runoff. Apply the same volume and schedule to your control plant every time.
Use our Grow Schedule Planner to lock in your baseline timing from day one — this is particularly important when you're comparing training techniques that diverge on specific days.
What to Test Against Your Control Plant
The control plant concept works for virtually any variable you want to evaluate. Here are the most common — and most revealing — experiments home growers run:
Training Techniques
This is where the control plant pays for itself most visibly. Run your control plant with no training — no topping, no fimming, no LST, no manifolding. Let it grow as a natural Christmas tree. Now top or LST your experimental plant on day 21 of veg. By week 4 of flower, the canopy difference, site count, and bud development will be obvious. For a deep dive on the topping side of this experiment, check out our Fimming vs Topping guide.
Nutrient Lines and Additives
Switching from your current nutrient line to a new one? Run the control plant on the old formula, the experimental plant on the new one — same EC, same pH, same schedule. This is the only reliable way to know whether that expensive additive is actually increasing trichome density or just lightening your wallet. Use our Nutrient Deficiency Identifier to flag any issues that appear on either plant during the test.
Environmental Interventions
Testing a new CO₂ supplementation setup? A new dehumidifier? Elevated canopy temperature during ripening? The control plant running at ambient conditions tells you exactly how much your intervention moved the needle — not just whether the harvest was "good."
Genetics Within the Same Strain
Running two phenotypes of the same strain? Treat one as the control under your standard conditions and pheno-hunt using the other. Same logic, slightly different application.
How to Track Your Control Plant Data
A control plant is useless without consistent data logging. You need identical observation points on both plants at every stage — otherwise you're just growing two plants, not running an experiment.
At minimum, log these data points weekly for both plants:
- Height and canopy width (cm/inches)
- Internode spacing
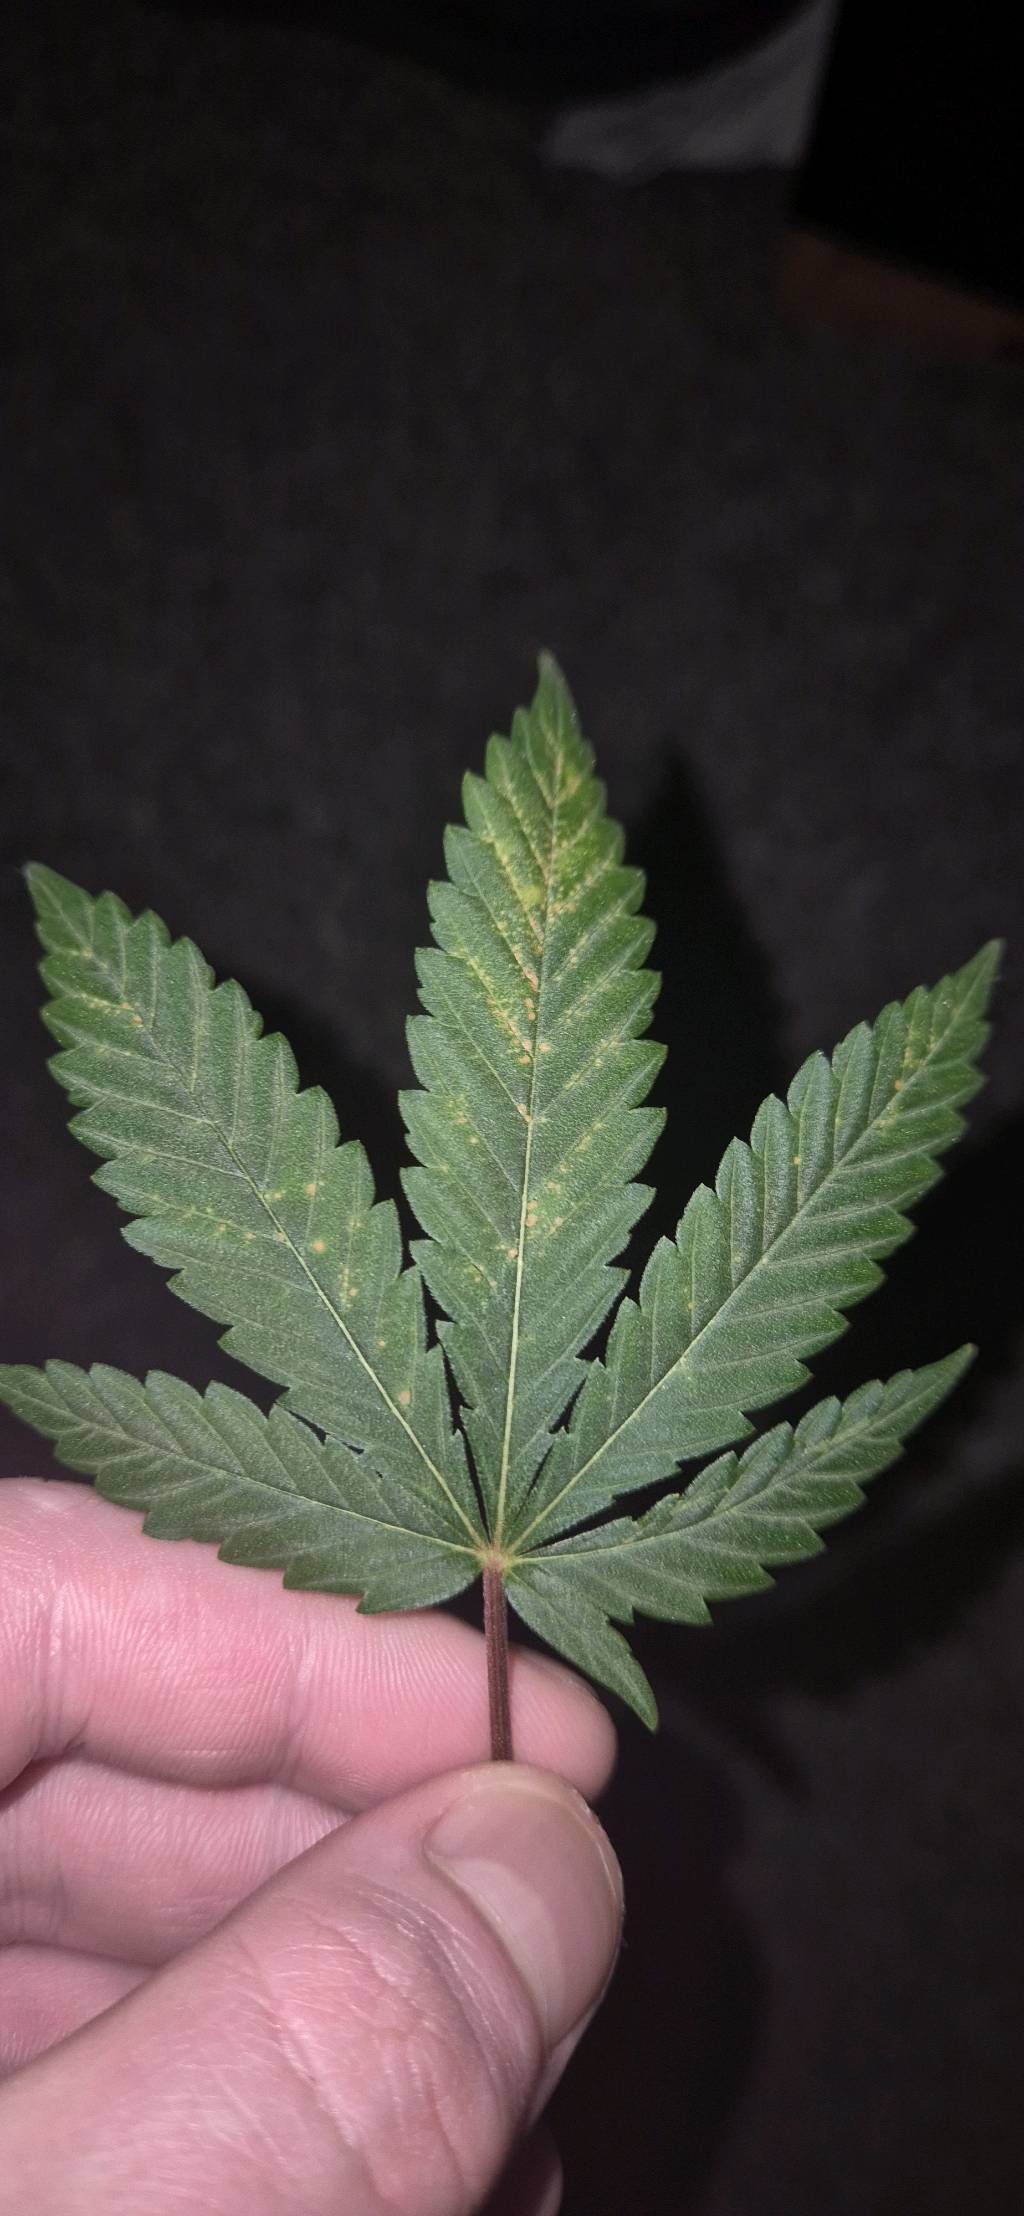
- Leaf colour and any visible deficiency symptoms
- Runoff EC and pH
- Number of visible bud sites (from flip onwards)
- Temperature and RH at canopy level
At harvest, weigh both plants wet, then dry. This is your headline number. A well-structured grow journal makes this systematic — see our guide on how to keep a cannabis grow diary for a format that captures all of this without becoming a second job. Our Yield Calculator can also help you project and compare expected vs actual output for each plant.
Reading the Results: What the Data Actually Tells You
Once you have parallel data from both plants, comparison becomes straightforward. Ask three questions:
- Did the experimental plant yield more dry weight than the control? If yes by more than ~10–15% (accounting for natural plant variation), your intervention likely helped. Less than that and it's within normal variance.
- Did the experimental plant show any negative indicators the control didn't? Yellowing, tip burn, stunted growth, or reduced bud density that the control plant avoided points to a problem with your intervention.
- Did both plants show the same issue? If your control plant also shows the problem, the issue is environmental or systemic — not caused by your experiment. This is the control plant doing exactly what it's supposed to do: ruling things out.
Common Scenarios the Control Plant Clarifies
| Observation | Control Plant | What It Means |
|---|---|---|
| Experimental plant shows N deficiency | Healthy, green | New nutrient line is underdosing N — increase EC or adjust formula |
| Both plants show tip burn | Also showing tip burn | Environmental issue (high heat, low humidity, Ca toxicity) — not the experiment |
| Experimental plant 30% heavier at harvest | Baseline yield | Training technique or nutrient additive is delivering real gains — worth repeating |
| Both plants yield similarly | Baseline yield | Your intervention had no measurable effect — save the money or time |
Control Plant Strategy for Harvest, Dry, and Cure
The control plant concept extends right through to post-harvest. Harvest both plants using trichome inspection: clear trichomes indicate immaturity, cloudy trichomes signal peak THC, and amber trichomes suggest THC degrading to CBN. For most balanced effects, harvest when 70–80% of trichomes are cloudy with 10–20% amber.
After harvest, dry both plants in the same environment: 60–70°F (15–21°C) with 55–60% RH for 7–10 days. Cure in separate airtight jars, burping daily for the first week, then every few days for 4–8 weeks total. Weigh each batch at the start and end of cure — the control plant's cure weight gives you a reference for moisture loss rate and final density.
Our Dry & Cure Timer tracks both batches simultaneously so you can compare cure duration against final product quality side by side.
Common Control Plant Mistakes to Avoid
- Using a different strain as your control: Genetics account for massive variation in yield, stretch, and cannabinoid profile. Same strain, same pheno, same seed batch where possible.
- Changing multiple variables on the experimental plant: If you top it AND switch its nutrients, you can't tell which change drove the outcome. Change one thing at a time.
- Neglecting the control plant: Some growers unconsciously give their exciting experimental plant more attention — extra feeds, extra training passes, better light positioning. Be deliberate about treating both plants identically except for the one variable you're testing.
- Not logging consistently: Memory is unreliable over a 90-day grow. Weekly photos and data points are non-negotiable if you want actionable conclusions.
- Running the experiment once and drawing firm conclusions: One grow cycle is a data point, not a verdict. Repeat the test with interesting results before committing to the new approach across your whole garden.
If you're just getting started with methodical indoor growing, our guide on how to grow one cannabis plant indoors covers the foundational setup that makes control plant experiments possible. You need a stable baseline before you can measure deviation from it.
Frequently Asked Questions
How many plants do I need to run a control plant experiment?
At minimum, two plants: one control and one experimental. Ideally three or more — one control and two experimental plants — so you can average out natural variation between individuals. Running only two plants means one unusual phenotype expression can skew your entire conclusion.
Can I run a control plant experiment in a small tent?
Yes. A 2×4 ft (60×120 cm) tent comfortably fits two plants in fabric pots. Position them equidistant from the centre of your light, maintain identical airflow across both, and the results will be valid. Smaller tents make it easier to control the environment consistently.
Does the control plant need to be the same clone or just the same strain?
Clones are the gold standard — they're genetically identical, which removes phenotype variation entirely. If you're working from seed, select two plants that show identical vigour and structure in early veg, then designate the most average-looking one as your control.
What if my control plant performs better than my experimental plant?
That's a completely valid and useful result — it means your intervention made things worse, not better. Stop applying it, document what happened, and your baseline is confirmed as the superior approach. This is exactly the kind of outcome a control plant is designed to catch before you scale the mistake across your whole garden.
How do I account for light variation across my tent when running a control plant?
Use a PAR meter to map PPFD at canopy height across your tent and position both plants in zones with matching readings. Most lights produce a hot spot in the centre — placing both plants at the same radius from centre achieves near-identical PPFD. Our Grow Light Calculator can help you understand your light's coverage footprint.
References
- GrowCycle (2026). "Advanced Cultivation Techniques for Cannabis Growers." Covers environmental control systems including temperature ranges (70–85°F), humidity management, and CO₂ optimisation for indoor cannabis. growcycle.com
- FloraFlex (2026). "Common Mistakes in Cannabis Cultivation and Their Solutions." Details overwatering prevention strategies, optimal coco/perlite ratios (70/30), and pH management for soil (6.0–6.5) and hydro (5.5–6.5) systems. floraflex.com
- MMJ.com (2026). "Drying and Curing Cannabis: A Complete Guide." Covers optimal drying conditions (60–70°F, 55–60% RH, 7–10 days) and curing protocols including burping schedules and 2–8 week cure windows. mmj.com
- Grow Guide Platform Data (2026). Internal analysis of 1,000 tracked grow journals showing 736 indoor grows (73.6%), 632 soil-medium growers (63.2%), and feeding method distribution across the user base. growguide.app
- Chandra, S., Lata, H., Khan, I.A., & ElSohly, M.A. (2017). "Cannabis sativa L.: Botany and Biotechnology." Springer. Documents the importance of controlled environmental variables — including PPFD, temperature, and VPD — on cannabis yield and cannabinoid production in controlled cultivation settings.